LCA Examples
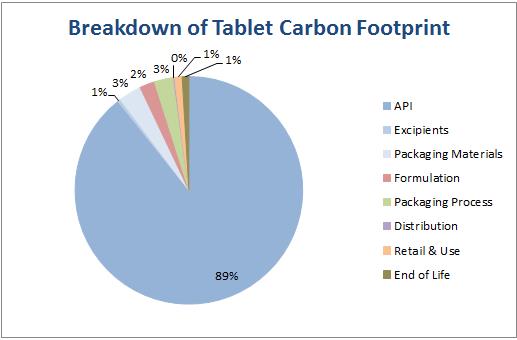
By examining API LCAs we can understand where carbon footprints and other ‘hotspots’ are. The first example is an anti-inflammatory API. The carbon footprint breakdown of the product formulated as tablets in a simple blister pack is given in Figure 1 (Tools and assumptions available in Appendix). As can be seen, the API synthesis contribution dominates the carbon footprint. This is fairly atypical for an average pharmaceutical product, and reflects the current niche therapeutic area in which the API is used as well as the small production run of 20 tonnes per annum. The manufacturing route is dated and inefficient having been established over thirty years ago. For example, a Novartis case study looking at the cradle-to-grave LCA/supply chain carbon footprint of Dry Powder Inhaler (DPI) devices found their device to have a carbon footprint of 3.3 kgCO2e. [1] To contextualise, this figure of 3.3 kgCO2e per annum would equate to driving 22 miles in an average car, and this was shown to be one of the better DPI devices on the market in terms of its environmental impact. [2]
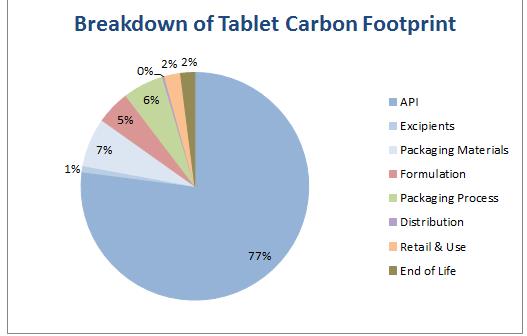
Redesigning to a more efficient synthetic route to the API gives the carbon footprint shown in Figure 2. This reduces the effective carbon contribution of the API to the tablet from 89% to 77%, but also reduces the carbon footprint per tablet from 354 gCO2 to 166 gCO2, thus the benefits of changing the synthetic route are significant with respect to the carbon footprint as a whole. Looking at the contribution of the rest of the secondary manufacturing process, the API still dominates due to the low total annual production. Typically economies of scale work in both primary (synthesis of main product) and secondary (formulation and packaging) manufacturing, but are more pronounced with API manufacture.[3]
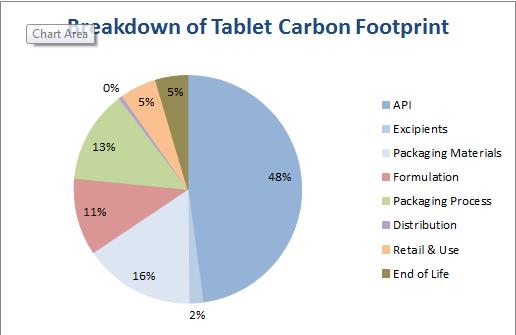
Modelling the process to a production scale of 200 tonnes per annum gives a picture that is more representative of pharmaceuticals produced in higher volumes, with only 48% of the carbon intensity being due to the API synthesis; the contributions of the other inputs in secondary manufacturing are now clearer and can be seen in Figure 3.
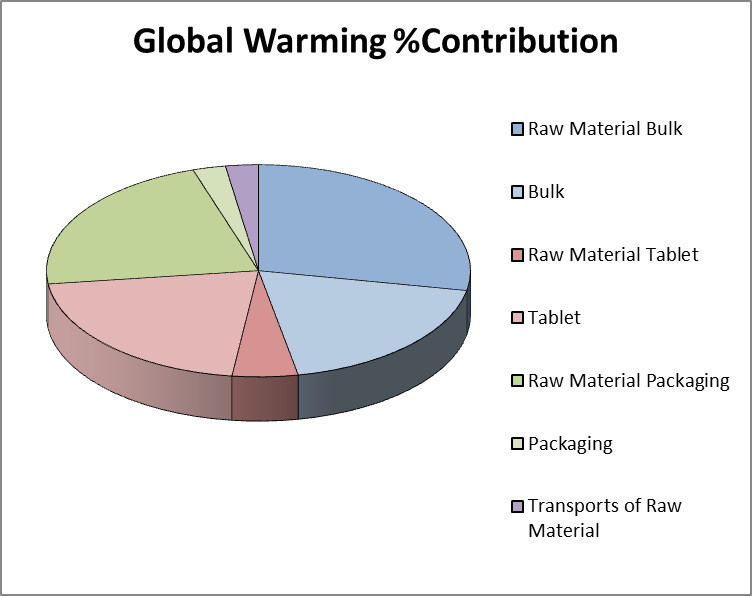
The second example is a selective β1–blocker, prescribed for hypertension and other cardiovascular conditions. In 2011, this medicine was the 19th most commonly prescribed generic medicine, so is a large volume product. The output of an LCA study focusing on secondary manufacturing is presented in Figure 4 and gives a more representative example of the carbon footprint of most bulk pharmaceutical products.
Note: The information for both of the case studies above has been compiled as part of the CHEM21 project from confidential partner data.
-
Novartis Environmental Sustainability Strategy, (Last accessed: September 2022)
- , Environmental resource footprinting of drug manufacturing: Effects of scale-up and tablet dosage, Resources, Conservation and Recycling, 2014, 91, 82-88.