Main Effects and Interactions
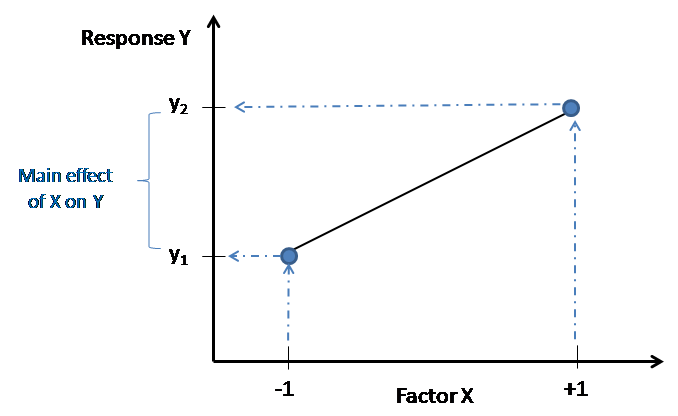
A main effect is a measure of the average change in the response when the control factor is changed from the low settings (-1) to the high settings (+1) defined by the range studied (Figure 1).
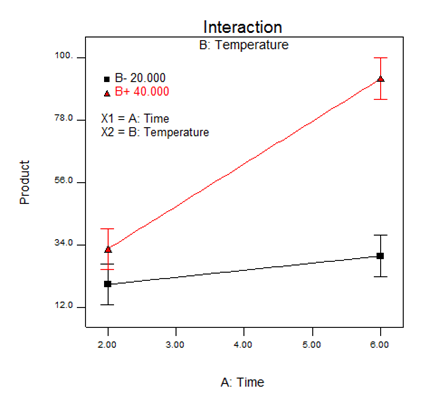
Interactions occur where the impact of a parameter is dependent on the setting of a second parameter. DoE experiments can identify interactions as many parameters are changed simultaneously in the design. A commonly seen example of an interaction is time vs. temperature (Figure 2).
By using experimental design, a mathematical model of the chemical process is generated. The analysis of experimental design studies uses multiple linear regression to fit a polynomial model to the experimental data. Each response is modelled using the important factors and the outcome of a process can then be predicted for a given set of parameters.
For a response y, the mathematical equation can be denoted as followed:
Where